Getting Data
Contents
!pip install geopandas shapely fiona pyproj rtree
Requirement already satisfied: geopandas in c:\users\barguzin\anaconda3\envs\geo_env\lib\site-packages (0.11.1)
Requirement already satisfied: shapely in c:\users\barguzin\anaconda3\envs\geo_env\lib\site-packages (1.8.4)
Requirement already satisfied: fiona in c:\users\barguzin\anaconda3\envs\geo_env\lib\site-packages (1.8.21)
Requirement already satisfied: pyproj in c:\users\barguzin\anaconda3\envs\geo_env\lib\site-packages (3.4.0)
Requirement already satisfied: rtree in c:\users\barguzin\anaconda3\envs\geo_env\lib\site-packages (0.9.7)
Requirement already satisfied: pandas>=1.0.0 in c:\users\barguzin\anaconda3\envs\geo_env\lib\site-packages (from geopandas) (1.4.4)
Requirement already satisfied: packaging in c:\users\barguzin\anaconda3\envs\geo_env\lib\site-packages (from geopandas) (21.3)
Requirement already satisfied: attrs>=17 in c:\users\barguzin\anaconda3\envs\geo_env\lib\site-packages (from fiona) (21.4.0)
Requirement already satisfied: certifi in c:\users\barguzin\anaconda3\envs\geo_env\lib\site-packages (from fiona) (2022.9.24)
Requirement already satisfied: click>=4.0 in c:\users\barguzin\anaconda3\envs\geo_env\lib\site-packages (from fiona) (8.0.4)
Requirement already satisfied: cligj>=0.5 in c:\users\barguzin\anaconda3\envs\geo_env\lib\site-packages (from fiona) (0.7.2)
Requirement already satisfied: click-plugins>=1.0 in c:\users\barguzin\anaconda3\envs\geo_env\lib\site-packages (from fiona) (1.1.1)
Requirement already satisfied: six>=1.7 in c:\users\barguzin\anaconda3\envs\geo_env\lib\site-packages (from fiona) (1.16.0)
Requirement already satisfied: munch in c:\users\barguzin\anaconda3\envs\geo_env\lib\site-packages (from fiona) (2.5.0)
Requirement already satisfied: setuptools in c:\users\barguzin\anaconda3\envs\geo_env\lib\site-packages (from fiona) (65.5.0)
Requirement already satisfied: colorama in c:\users\barguzin\anaconda3\envs\geo_env\lib\site-packages (from click>=4.0->fiona) (0.4.5)
Requirement already satisfied: pytz>=2020.1 in c:\users\barguzin\anaconda3\envs\geo_env\lib\site-packages (from pandas>=1.0.0->geopandas) (2022.1)
Requirement already satisfied: python-dateutil>=2.8.1 in c:\users\barguzin\anaconda3\envs\geo_env\lib\site-packages (from pandas>=1.0.0->geopandas) (2.8.2)
Requirement already satisfied: numpy>=1.21.0 in c:\users\barguzin\anaconda3\envs\geo_env\lib\site-packages (from pandas>=1.0.0->geopandas) (1.23.3)
Requirement already satisfied: pyparsing!=3.0.5,>=2.0.2 in c:\users\barguzin\anaconda3\envs\geo_env\lib\site-packages (from packaging->geopandas) (3.0.9)
import fiona
import pandas as pd
import geopandas as gpd
import matplotlib.pyplot as plt
import seaborn as sns
import numpy as np
Getting Data#
Fire Perimeters#
! wget https://frap.fire.ca.gov/media/3ufh3ajg/fire21_1.zip -O fire_perims.zip -nc
File 'fire_perims.zip' already there; not retrieving.
! unzip -n fire_perims.zip
Archive: fire_perims.zip
! ls
'ls' is not recognized as an internal or external command,
operable program or batch file.
gdb_file = 'fire21_1.gdb'

# Get all the layers from the .gdb file
layers = fiona.listlayers(gdb_file)

for layer in layers:
  if layer == 'firep21_1': # there are 3 files in gdb, we only need one
    print(f'found file: {layer}')
    fires = gpd.read_file(gdb_file,layer=layer)
found file: firep21_1
fires.shape
(21686, 18)
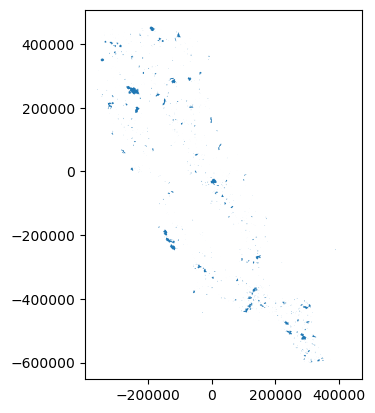
# there are 20k fires in the data set, lets randomly plot 1000 of them
fires.sample(1000).plot()
<AxesSubplot:>
fires.head()
| YEAR_ | STATE | AGENCY | UNIT_ID | FIRE_NAME | INC_NUM | ALARM_DATE | CONT_DATE | CAUSE | COMMENTS | REPORT_AC | GIS_ACRES | C_METHOD | OBJECTIVE | FIRE_NUM | Shape_Length | Shape_Area | geometry | |
|---|---|---|---|---|---|---|---|---|---|---|---|---|---|---|---|---|---|---|
| 0 | 2020 | CA | CDF | NEU | NELSON | 00013212 | 2020-06-18T00:00:00+00:00 | 2020-06-23T00:00:00+00:00 | 11.0 | 110.0 | 109.602280 | 1.0 | 1.0 | None | 3252.523280 | 4.435447e+05 | MULTIPOLYGON (((-116841.251 97942.565, -116836... | |
| 1 | 2020 | CA | CDF | NEU | AMORUSO | 00011799 | 2020-06-01T00:00:00+00:00 | 2020-06-04T00:00:00+00:00 | 2.0 | 670.0 | 685.585022 | 1.0 | 1.0 | None | 9653.760308 | 2.774464e+06 | MULTIPOLYGON (((-117328.400 90212.407, -117321... | |
| 2 | 2020 | CA | CDF | NEU | ATHENS | 00018493 | 2020-08-10T00:00:00+00:00 | 2020-03-01T00:00:00+00:00 | 14.0 | 26.0 | 27.300480 | 1.0 | 1.0 | None | 1649.643235 | 1.104811e+05 | MULTIPOLYGON (((-115605.059 92988.787, -115585... | |
| 3 | 2020 | CA | CDF | NEU | FLEMING | 00007619 | 2020-03-31T00:00:00+00:00 | 2020-04-01T00:00:00+00:00 | 9.0 | 13.0 | 12.931545 | 1.0 | 1.0 | None | 1577.155857 | 5.233211e+04 | MULTIPOLYGON (((-110213.270 105975.579, -11020... | |
| 4 | 2020 | CA | CDF | NEU | MELANESE | 00008471 | 2020-04-14T00:00:00+00:00 | 2020-04-19T00:00:00+00:00 | 18.0 | 10.3 | 10.315964 | 1.0 | 1.0 | None | 1035.787625 | 4.174722e+04 | MULTIPOLYGON (((-111793.600 164243.615, -11177... |
fires.dtypes
YEAR_             object
STATE             object
AGENCY            object
UNIT_ID           object
FIRE_NAME         object
INC_NUM           object
ALARM_DATE        object
CONT_DATE         object
CAUSE            float64
COMMENTS          object
REPORT_AC        float64
GIS_ACRES        float64
C_METHOD         float64
OBJECTIVE        float64
FIRE_NUM          object
Shape_Length     float64
Shape_Area       float64
geometry        geometry
dtype: object
# lets drop some variables that we will not be using
print(fires.shape[1])
fires.drop(['STATE', 'COMMENTS', 'C_METHOD', 'OBJECTIVE'], axis=1, inplace=True)
print(fires.shape[1])
18
14
# some mumbo jumbo with the dates
fires['ALARM_DATE'] = fires.ALARM_DATE.str.slice(0,10)
fires['CONT_DATE'] = fires.CONT_DATE.str.slice(0,10)
fires
| YEAR_ | AGENCY | UNIT_ID | FIRE_NAME | INC_NUM | ALARM_DATE | CONT_DATE | CAUSE | REPORT_AC | GIS_ACRES | FIRE_NUM | Shape_Length | Shape_Area | geometry | |
|---|---|---|---|---|---|---|---|---|---|---|---|---|---|---|
| 0 | 2020 | CDF | NEU | NELSON | 00013212 | 2020-06-18 | 2020-06-23 | 11.0 | 110.0 | 109.602280 | None | 3.252523e+03 | 4.435447e+05 | MULTIPOLYGON (((-116841.251 97942.565, -116836... |
| 1 | 2020 | CDF | NEU | AMORUSO | 00011799 | 2020-06-01 | 2020-06-04 | 2.0 | 670.0 | 685.585022 | None | 9.653760e+03 | 2.774464e+06 | MULTIPOLYGON (((-117328.400 90212.407, -117321... |
| 2 | 2020 | CDF | NEU | ATHENS | 00018493 | 2020-08-10 | 2020-03-01 | 14.0 | 26.0 | 27.300480 | None | 1.649643e+03 | 1.104811e+05 | MULTIPOLYGON (((-115605.059 92988.787, -115585... |
| 3 | 2020 | CDF | NEU | FLEMING | 00007619 | 2020-03-31 | 2020-04-01 | 9.0 | 13.0 | 12.931545 | None | 1.577156e+03 | 5.233211e+04 | MULTIPOLYGON (((-110213.270 105975.579, -11020... |
| 4 | 2020 | CDF | NEU | MELANESE | 00008471 | 2020-04-14 | 2020-04-19 | 18.0 | 10.3 | 10.315964 | None | 1.035788e+03 | 4.174722e+04 | MULTIPOLYGON (((-111793.600 164243.615, -11177... |
| ... | ... | ... | ... | ... | ... | ... | ... | ... | ... | ... | ... | ... | ... | ... |
| 21681 | 2021 | USF | SQF | BOYDEN 1 | 00000401 | 2021-03-03 | 2021-03-18 | 5.0 | 15.0 | 14.573442 | None | 9.276290e+02 | 5.897663e+04 | MULTIPOLYGON (((105451.745 -132832.621, 105410... |
| 21682 | 2021 | USF | INF | GLACIER NORTH | 00001732 | 2021-07-15 | 2021-08-20 | 1.0 | 37.0 | 37.255802 | None | 2.334983e+03 | 1.507689e+05 | MULTIPOLYGON (((139955.910 -95054.743, 139970.... |
| 21683 | 2021 | CCO | KRN | Backus 2 | 02118345 | 2021-04-25 | 2021-04-25 | 14.0 | 4.0 | 2.897352 | None | 6.368478e+02 | 1.172517e+04 | MULTIPOLYGON (((164896.149 -338556.435, 164893... |
| 21684 | 2021 | CDF | BTU | DIXIE | 00009205 | 2021-07-14 | 2021-10-25 | 11.0 | 963309.0 | 963405.437500 | None | 1.533820e+06 | 3.898763e+09 | MULTIPOLYGON (((-92538.590 256767.148, -92537.... |
| 21685 | 2021 | USF | KNF | RIVER COMPLEX | 00006385 | 2021-07-31 | 2021-10-25 | 1.0 | 155752.0 | 199354.093750 | None | 1.216645e+06 | 8.067574e+08 | MULTIPOLYGON (((-259575.040 330786.059, -25957... |
21686 rows × 14 columns
# calculate the number of where date is missing
print('number of missing records for alarm date:', fires.ALARM_DATE.isnull().sum())
print('number of missing records for containment date:', fires.CONT_DATE.isnull().sum())
number of missing records for alarm date: 5357
number of missing records for containment date: 12666
# convert variables to datetime
fires['ALARM_DATE'] = pd.to_datetime(fires.ALARM_DATE, errors='coerce')
fires['CONT_DATE'] = pd.to_datetime(fires.CONT_DATE, errors='coerce')
# calculate new variable duration
#fires['dur_days'] = (fires.CONT_DATE - fires.ALARM_DATE).dt.days
fires['dur_days'] = (fires.CONT_DATE - fires.ALARM_DATE).astype('timedelta64[D]')

print('Values where alarm date is before containment date:', fires.loc[fires.dur_days<0].shape[0])
Values where alarm date is before containment date: 32
fires.dur_days.isnull().sum()
12678
# drop where we have missing duration
print(fires.shape)
fires = fires.loc[fires.dur_days>0,]
print(fires.shape)
(21686, 15)
(5250, 15)
California Counties#
ca_counties = gpd.read_file('https://raw.githubusercontent.com/codeforgermany/click_that_hood/main/public/data/california-counties.geojson')
print(ca_counties.shape)
ca_counties.head()
(58, 5)
| name | cartodb_id | created_at | updated_at | geometry | |
|---|---|---|---|---|---|
| 0 | Alameda | 1 | 2015-07-04 21:04:58+00:00 | 2015-07-04 21:04:58+00:00 | MULTIPOLYGON (((-122.31293 37.89733, -122.2884... |
| 1 | Alpine | 2 | 2015-07-04 21:04:58+00:00 | 2015-07-04 21:04:58+00:00 | POLYGON ((-120.07239 38.70277, -119.96495 38.7... |
| 2 | Amador | 3 | 2015-07-04 21:04:58+00:00 | 2015-07-04 21:04:58+00:00 | POLYGON ((-121.02726 38.48925, -121.02741 38.5... |
| 3 | Butte | 4 | 2015-07-04 21:04:58+00:00 | 2015-07-04 21:04:58+00:00 | POLYGON ((-121.87925 39.30361, -121.90831 39.3... |
| 4 | Calaveras | 5 | 2015-07-04 21:04:58+00:00 | 2015-07-04 21:04:58+00:00 | POLYGON ((-120.87605 38.02889, -120.91875 38.0... |
Projections!#
# check
print(fires.crs)
print(ca_counties.crs)
epsg:3310
epsg:4326
# let's convert both of those to epsg:3857
# this will take a while - lots of calculations
fires = fires.to_crs('epsg:3857')
ca_counties = ca_counties.to_crs('epsg:3857')
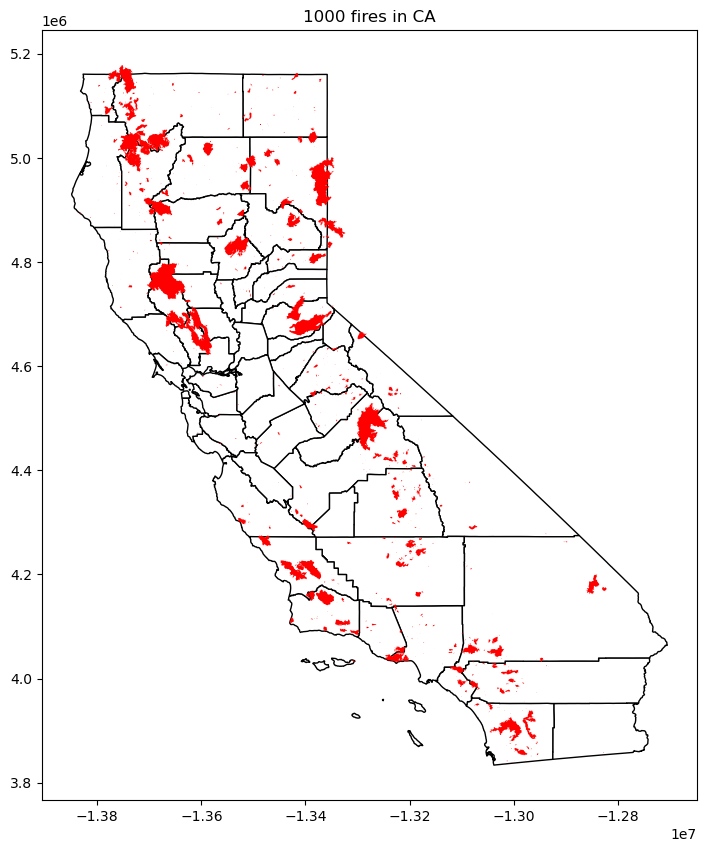
# plot fires on CA
fig,ax = plt.subplots(figsize=(10,10))

ca_counties.plot(ax=ax, facecolor='w', ec='k');
fires.sample(1000).plot(fc='r', ax=ax);

plt.title('1000 fires in CA');
# THIS PART OF CODE IS OPENING A FILE VIA OGR - SKIP
# SOME LABELS ARE NOT READ BY GEOPANDAS
# from osgeo import ogr

# driver = ogr.GetDriverByName("OpenFileGDB")
# ds = driver.Open("fire21_1.gdb", 0)
# f = ds.GetLayer("firep21_1")
# print(type(f))
Measures of Location and Variation#
print('mean', fires.GIS_ACRES.mean())
print('median', fires.GIS_ACRES.median())
print('std', fires.GIS_ACRES.std())
mean 4342.1049991099635
median 135.8330841064453
std 28498.10488152866
Visualizing Data#
Histograms#
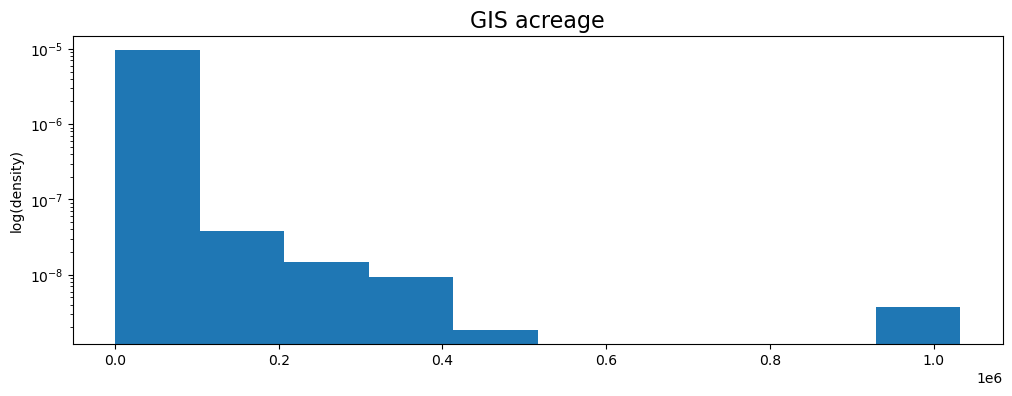
fig, ax = plt.subplots(figsize=(12,4))

fires.GIS_ACRES.plot(density=True, logy=True, kind='hist', ax=ax);

# changing title and labels
ax.set_title('GIS acreage', fontsize=16);
ax.set_ylabel('log(density)');
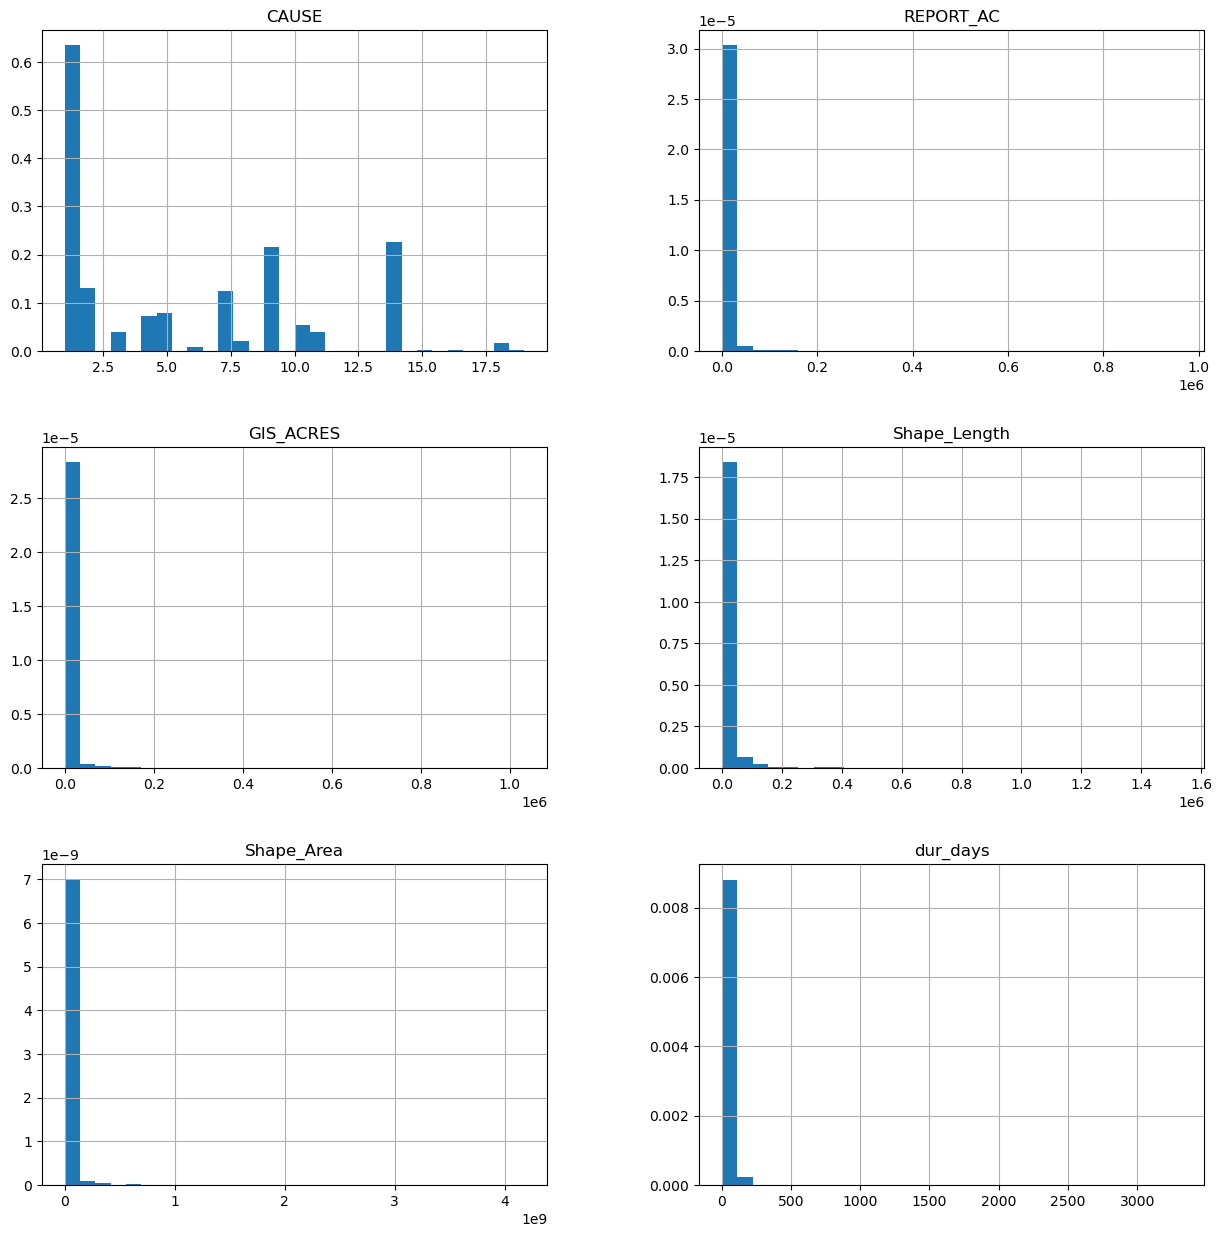
# create histograms for all numeric variables
num_vars = fires.select_dtypes(include=np.number).columns.tolist()
num_vars
['CAUSE', 'REPORT_AC', 'GIS_ACRES', 'Shape_Length', 'Shape_Area', 'dur_days']
fires[num_vars].hist(density=True, bins=30, figsize=(15,15));
# we can also call histogram from matplotlib interface
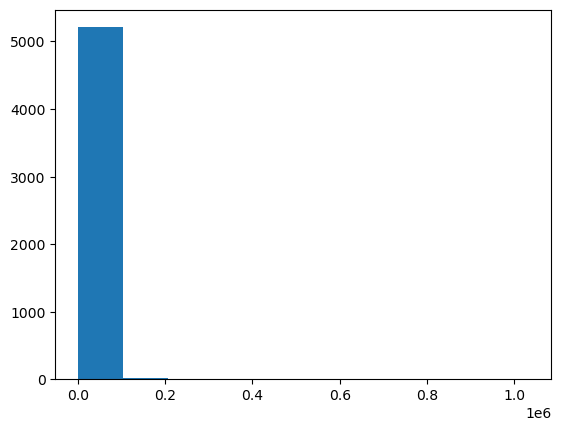
plt.hist(fires.GIS_ACRES);
Asking interesting questions about data#
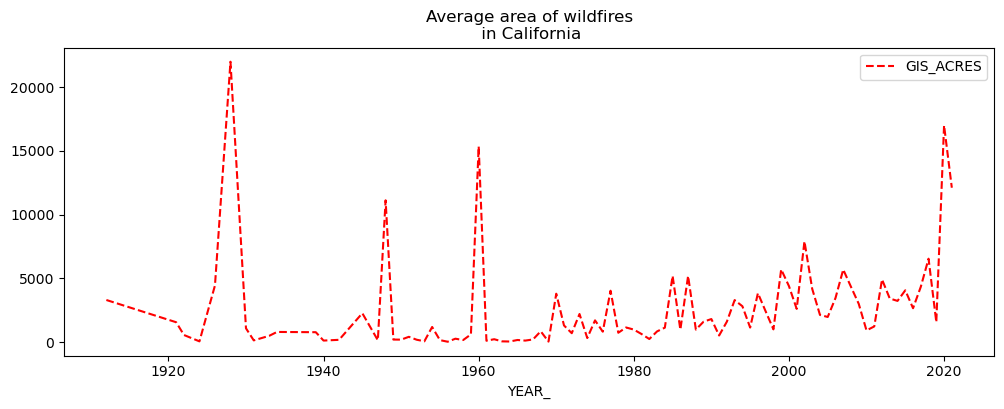
What is the average size of wildfires in CA
Does average size of fires increase over time?
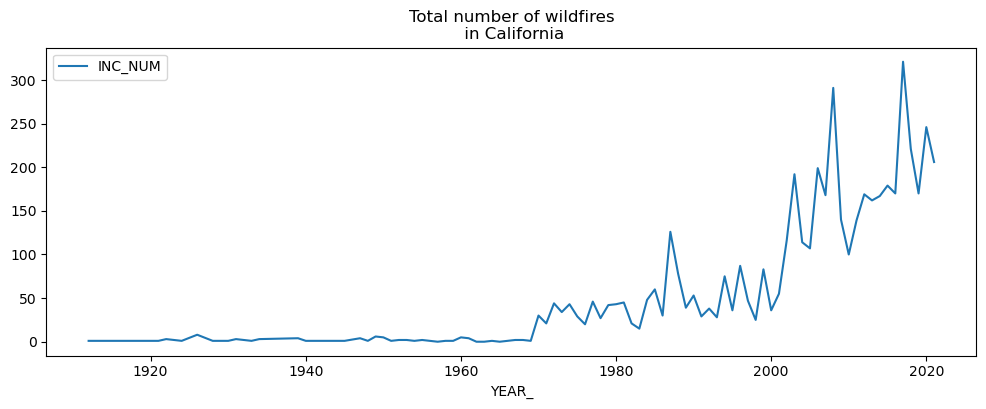
How many fires do we have per year?
Does the number of fires increase over time?
How does average fire duration change?
# calculating average size of fires in CA
fires.area.mean() # this is in square meters: 28,624,990
28624990.01473281
# convert YEAR_ to int
fires.YEAR_ = fires.YEAR_.astype(int)
fires.dtypes
YEAR_                    int32
AGENCY                  object
UNIT_ID                 object
FIRE_NAME               object
INC_NUM                 object
ALARM_DATE      datetime64[ns]
CONT_DATE       datetime64[ns]
CAUSE                  float64
REPORT_AC              float64
GIS_ACRES              float64
FIRE_NUM                object
Shape_Length           float64
Shape_Area             float64
geometry              geometry
dur_days               float64
dtype: object
Grouping variables and summarizing#
# only use variables that you will be calculating on
avg_acres_by_year = fires[['YEAR_', 'GIS_ACRES']].groupby('YEAR_')["GIS_ACRES"].mean().reset_index()

avg_acres_by_year.set_index('YEAR_', inplace=True)

avg_acres_by_year.plot(figsize=(12,4), title='Average area of wildfires\n in California', color='r', linestyle='dashed');
# only use variables that you will be calculating on
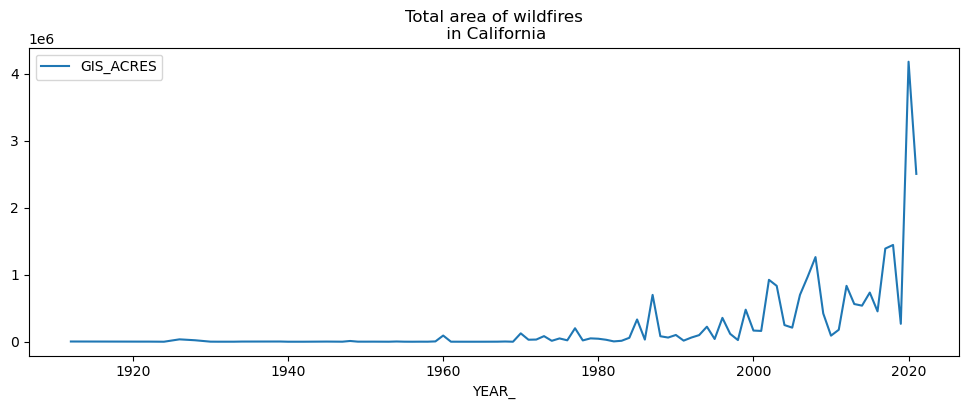
total_acres_by_year = fires[['YEAR_', 'GIS_ACRES']].groupby('YEAR_')["GIS_ACRES"].sum().reset_index()

total_acres_by_year.set_index('YEAR_', inplace=True)

total_acres_by_year.plot(figsize=(12,4), title='Total area of wildfires\n in California');
print(fires.shape[0]) # number of records
print(fires.INC_NUM.count()) # number of fire_id
5250
5083
# calculate number of fires per year
fires_per_year = fires[['YEAR_', 'INC_NUM']].groupby('YEAR_')["INC_NUM"].count().reset_index()

fires_per_year.set_index('YEAR_', inplace=True)

fires_per_year.plot(figsize=(12,4), title='Total number of wildfires\n in California');
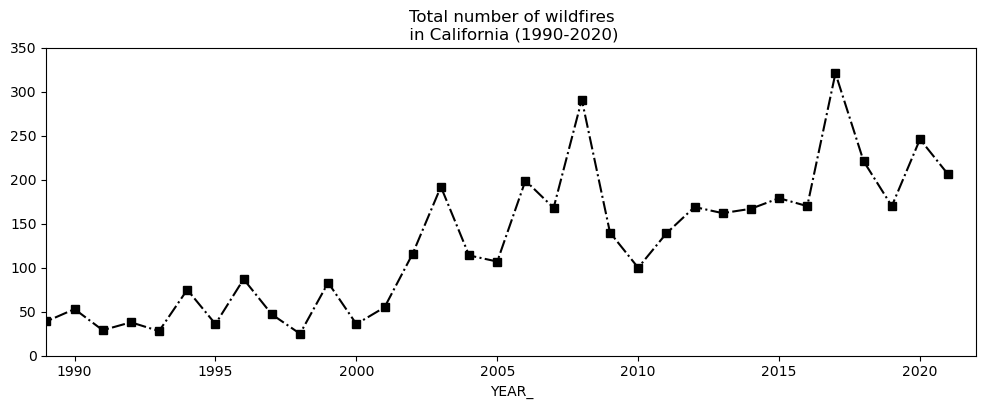
# zoom into specific years and change range on y-axis, remove legend label, change linestyle and marker style
fires_per_year.plot(figsize=(12,4), title='Total number of wildfires\n in California (1990-2020)', ylim=(0,350), xlim=(1989,2022), legend=False, color='k', marker='s', linestyle='-.');
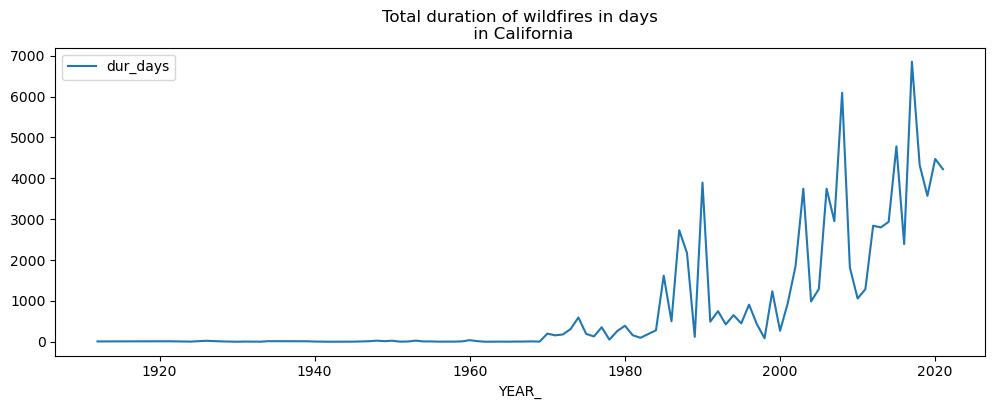
# total duration of fires per year
dur_per_year = fires[['YEAR_', 'dur_days']].groupby('YEAR_')["dur_days"].sum().reset_index()

dur_per_year.set_index('YEAR_', inplace=True)

dur_per_year.plot(figsize=(12,4), title='Total duration of wildfires in days\n in California');
# get temperature
ca_temps = pd.read_csv('https://www.ncei.noaa.gov/cag/statewide/time-series/4-tavg-12-12-1910-2022.csv?base_prd=true&begbaseyear=1901&endbaseyear=2000', skiprows=5, header=None, dtype={0:'str'}, nrows=100) # use this line if following lab instructions
#ca_temps = pd.read_csv('https://raw.githubusercontent.com/barguzin/ucsb_geog172/main/data/ca_avg_temps.csv', skiprows=5, header=None, dtype={0:'str'}, nrows=100)
print(ca_temps.shape)
ca_temps.head()
(1, 3)
| 0 | 1 | 2 | |
|---|---|---|---|
| 0 | NaN | -99 | -99 |
ca_temps.columns = ['date_year', 'temp', 'anomaly']
# prep year
# convert to
ca_temps.date_year = ca_temps.date_year.str.slice(0,4)

ca_temps.date_year = ca_temps.date_year.astype(int)

ca_temps.set_index('date_year', inplace=True)

ca_temps.tail()
---------------------------------------------------------------------------
ValueError                                Traceback (most recent call last)
Input In [38], in <cell line: 5>()
      1 # prep year
      2 # convert to
      3 ca_temps.date_year = ca_temps.date_year.str.slice(0,4)
----> 5 ca_temps.date_year = ca_temps.date_year.astype(int)
      7 ca_temps.set_index('date_year', inplace=True)
      9 ca_temps.tail()

File ~\Anaconda3\envs\geo_env\lib\site-packages\pandas\core\generic.py:5912, in NDFrame.astype(self, dtype, copy, errors)
   5905     results = [
   5906         self.iloc[:, i].astype(dtype, copy=copy)
   5907         for i in range(len(self.columns))
   5908     ]
   5910 else:
   5911     # else, only a single dtype is given
-> 5912     new_data = self._mgr.astype(dtype=dtype, copy=copy, errors=errors)
   5913     return self._constructor(new_data).__finalize__(self, method="astype")
   5915 # GH 33113: handle empty frame or series

File ~\Anaconda3\envs\geo_env\lib\site-packages\pandas\core\internals\managers.py:419, in BaseBlockManager.astype(self, dtype, copy, errors)
    418 def astype(self: T, dtype, copy: bool = False, errors: str = "raise") -> T:
--> 419     return self.apply("astype", dtype=dtype, copy=copy, errors=errors)

File ~\Anaconda3\envs\geo_env\lib\site-packages\pandas\core\internals\managers.py:304, in BaseBlockManager.apply(self, f, align_keys, ignore_failures, **kwargs)
    302         applied = b.apply(f, **kwargs)
    303     else:
--> 304         applied = getattr(b, f)(**kwargs)
    305 except (TypeError, NotImplementedError):
    306     if not ignore_failures:

File ~\Anaconda3\envs\geo_env\lib\site-packages\pandas\core\internals\blocks.py:580, in Block.astype(self, dtype, copy, errors)
    562 """
    563 Coerce to the new dtype.
    564
   (...)
    576 Block
    577 """
    578 values = self.values
--> 580 new_values = astype_array_safe(values, dtype, copy=copy, errors=errors)
    582 new_values = maybe_coerce_values(new_values)
    583 newb = self.make_block(new_values)

File ~\Anaconda3\envs\geo_env\lib\site-packages\pandas\core\dtypes\cast.py:1292, in astype_array_safe(values, dtype, copy, errors)
   1289     dtype = dtype.numpy_dtype
   1291 try:
-> 1292     new_values = astype_array(values, dtype, copy=copy)
   1293 except (ValueError, TypeError):
   1294     # e.g. astype_nansafe can fail on object-dtype of strings
   1295     #  trying to convert to float
   1296     if errors == "ignore":

File ~\Anaconda3\envs\geo_env\lib\site-packages\pandas\core\dtypes\cast.py:1237, in astype_array(values, dtype, copy)
   1234     values = values.astype(dtype, copy=copy)
   1236 else:
-> 1237     values = astype_nansafe(values, dtype, copy=copy)
   1239 # in pandas we don't store numpy str dtypes, so convert to object
   1240 if isinstance(dtype, np.dtype) and issubclass(values.dtype.type, str):

File ~\Anaconda3\envs\geo_env\lib\site-packages\pandas\core\dtypes\cast.py:1154, in astype_nansafe(arr, dtype, copy, skipna)
   1150 elif is_object_dtype(arr.dtype):
   1151
   1152     # work around NumPy brokenness, #1987
   1153     if np.issubdtype(dtype.type, np.integer):
-> 1154         return lib.astype_intsafe(arr, dtype)
   1156     # if we have a datetime/timedelta array of objects
   1157     # then coerce to a proper dtype and recall astype_nansafe
   1159     elif is_datetime64_dtype(dtype):

File ~\Anaconda3\envs\geo_env\lib\site-packages\pandas\_libs\lib.pyx:668, in pandas._libs.lib.astype_intsafe()

ValueError: cannot convert float NaN to integer
print(ca_temps.index.dtype)
print(dur_per_year.index.dtype)
int64
int64
# plot total duration of wildfires and average temps on two subplots

fig, (ax1,ax2) = plt.subplots(2,1,figsize=(12,8), sharex=True)

ca_temps.temp.plot(ax=ax1)
ax1.set_title('Average Temperature in CA')

dur_per_year.plot(ax=ax2)
ax2.set_title('Total duration of wildfires in CA')
Text(0.5, 1.0, 'Total duration of wildfires in CA')
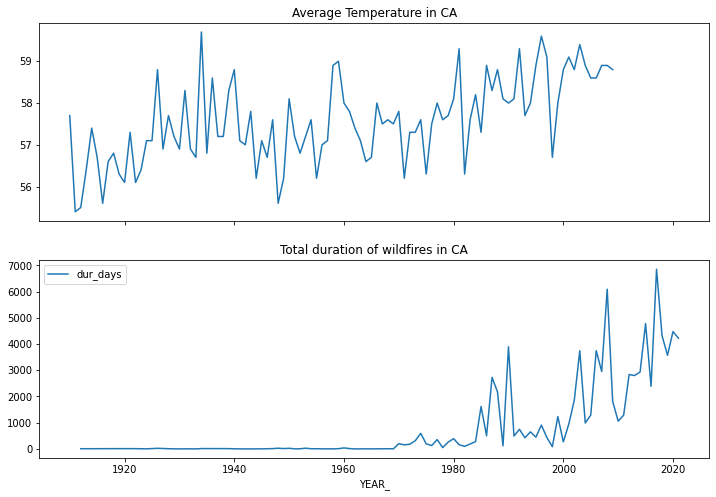
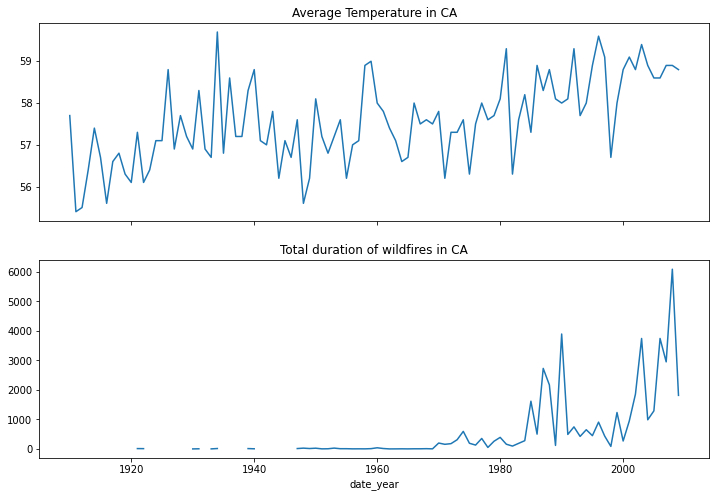
There is a problem with index alignment, we need to merge dataframes!#
merged = ca_temps.join(dur_per_year)

fig, (ax1,ax2) = plt.subplots(2,1,figsize=(12,8), sharex=True)

merged.temp.plot(ax=ax1)
ax1.set_title('Average Temperature in CA')

merged.dur_days.plot(ax=ax2)
ax2.set_title('Total duration of wildfires in CA')
Text(0.5, 1.0, 'Total duration of wildfires in CA')
Spatial join and some summary statistics#
Let’s imagine you work at the county GIS Department. You are tasked to describe the wildfire situation in that county. We need to be able to subset our data set by county. For that we need to run spatial join.
# join fires to counties
print(fires.shape) # total number of fires before join
sj = fires.sjoin(ca_counties[['name', 'geometry']], how='left') # only keep name and geometry other variables are not required
print(sj.shape) # total number of fires after join - notice some were duplicated because some fires stretch several couinties!
(5250, 15)
(5626, 17)
sj.head()
| YEAR_ | AGENCY | UNIT_ID | FIRE_NAME | INC_NUM | ALARM_DATE | CONT_DATE | CAUSE | REPORT_AC | GIS_ACRES | FIRE_NUM | Shape_Length | Shape_Area | geometry | dur_days | index_right | name | cartodb_id | created_at | updated_at | |
|---|---|---|---|---|---|---|---|---|---|---|---|---|---|---|---|---|---|---|---|---|
| 0 | 2020 | CDF | NEU | NELSON | 00013212 | 2020-06-18 | 2020-06-23 | 11.0 | 110.0 | 109.602280 | None | 3252.523280 | 4.435447e+05 | MULTIPOLYGON (((-13508442.409 4705925.209, -13... | 5.0 | 50.0 | Placer | 31.0 | 2015-07-04T21:04:58+00:00 | 2015-07-04T21:04:58+00:00 |
| 1 | 2020 | CDF | NEU | AMORUSO | 00011799 | 2020-06-01 | 2020-06-04 | 2.0 | 670.0 | 685.585022 | None | 9653.760308 | 2.774464e+06 | MULTIPOLYGON (((-13508926.470 4695975.605, -13... | 3.0 | 50.0 | Placer | 31.0 | 2015-07-04T21:04:58+00:00 | 2015-07-04T21:04:58+00:00 |
| 3 | 2020 | CDF | NEU | FLEMING | 00007619 | 2020-03-31 | 2020-04-01 | 9.0 | 13.0 | 12.931545 | None | 1577.155857 | 5.233211e+04 | MULTIPOLYGON (((-13500067.208 4716383.997, -13... | 1.0 | 50.0 | Placer | 31.0 | 2015-07-04T21:04:58+00:00 | 2015-07-04T21:04:58+00:00 |
| 4 | 2020 | CDF | NEU | MELANESE | 00008471 | 2020-04-14 | 2020-04-19 | 18.0 | 10.3 | 10.315964 | None | 1035.787625 | 4.174722e+04 | MULTIPOLYGON (((-13503127.052 4791691.861, -13... | 5.0 | 42.0 | Yuba | 58.0 | 2015-07-04T21:04:58+00:00 | 2015-07-04T21:04:58+00:00 |
| 6 | 2020 | DOD | BEA | VALLEY | 00015865 | 2020-07-15 | 2020-07-16 | 14.0 | 377.0 | 376.910400 | None | 7596.639583 | 1.525302e+06 | MULTIPOLYGON (((-13511624.004 4738027.149, -13... | 1.0 | 42.0 | Yuba | 58.0 | 2015-07-04T21:04:58+00:00 | 2015-07-04T21:04:58+00:00 |
fires_by_county = sj.groupby(['name'])['INC_NUM'].size().reset_index()

print(fires_by_county.shape)
fires_by_county.sort_values(by='INC_NUM', inplace=True)
print('top 10 counties with most fires')
fires_by_county[::-1][:10]
(57, 2)
top 10 counties with most fires
| name | INC_NUM | |
|---|---|---|
| 52 | Tulare | 360 |
| 45 | Siskiyou | 307 |
| 53 | Tuolumne | 276 |
| 14 | Kern | 274 |
| 24 | Modoc | 254 |
| 9 | Fresno | 251 |
| 51 | Trinity | 250 |
| 36 | San Diego | 246 |
| 35 | San Bernardino | 235 |
| 32 | Riverside | 216 |
print('bottom 10 counties with most fires')
fires_by_county[:10]
bottom 10 counties with most fires
| name | INC_NUM | |
|---|---|---|
| 33 | Sacramento | 2 |
| 39 | San Mateo | 3 |
| 49 | Sutter | 4 |
| 15 | Kings | 5 |
| 20 | Marin | 9 |
| 0 | Alameda | 10 |
| 37 | San Joaquin | 11 |
| 23 | Merced | 12 |
| 6 | Contra Costa | 13 |
| 12 | Imperial | 14 |
Optional: plot number of fires in top 10 counties in California over time#
from google.colab import drive
import os

# if you want to save file to your google drive
drive.mount('/content/drive/')
/content
Mounted at /content/drive/
/content
# save to Drive
fires.to_file('/content/drive/MyDrive/geog172/fires.geojson')
# we can also save it to the content of the GC session and then right click and download to local computer
fires.to_file('fires.geojson')

